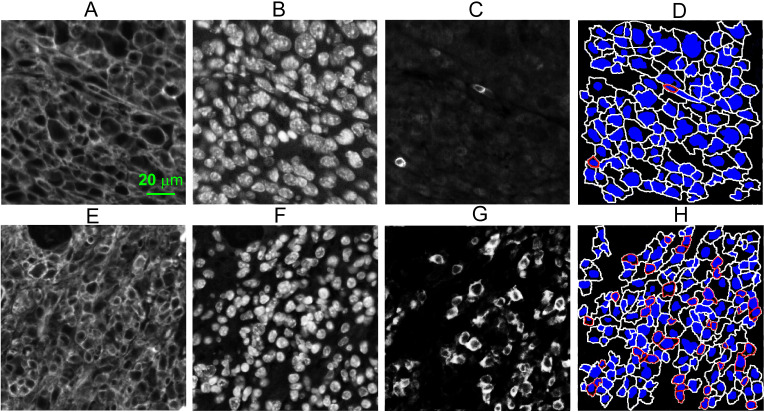
Figure 4.
Examples of immunohistochemical analyzes of MC38 tumors treated with either control IgG (A–D) or checkpoint inhibitors (E–H). (A, E) Fluorescence images of Na+/K+-ATPase stained MC38 tumor cells; (B, F) fluorescence images of DAPI stained MC38 tumor cells; (C, G) fluorescence images of CD3 stained T cells; (D, H) segmented cells with blue nuclei and T cells outlined in red or tumor cells outlined in white.

