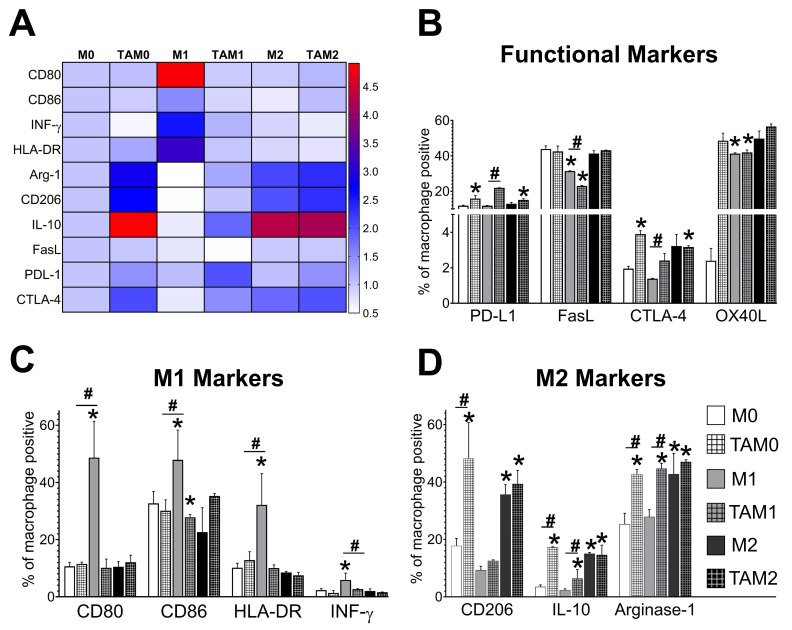
Figure 1.
GBex induced a phenotype like TAMs in different macrophages subsets. (A) The heat map shows the fold of decrease or increase in expression of macrophage markers evaluated by flow cytometry and considering M0 as control (B) percent of macrophages positive for functional immunomodulatory markers PDL-1, FasL, CTLA-4 and OX40L); (C) M1 markers (CD86, CD80, HLA-DR INF)-γ; (D) M2 markers (CD206, Arginase-2 and IL-10). Data were analyzed by flow cytometry as described in Materials and Methods. Data represent mean ± SD of three independent experiments performed in triplicate. Data were analyzed by ANOVA followed by Tukey post hoc. *Significantly different from macrophage M0 cells (white bar); #significantly different between macrophage and TAM cells (p < 0.05).

