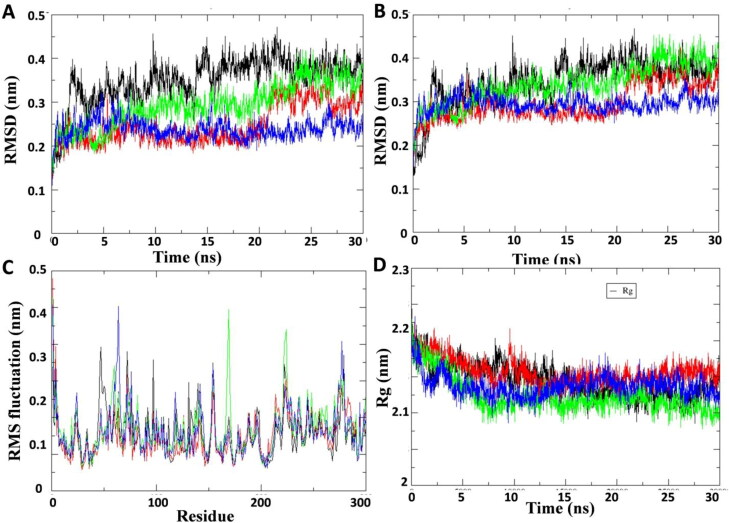
Figure 3.
Plot of molecular dynamic simulation trajectories of COVID-19 Mpro protein and protein-ligand complex during 30 ns simulation. (A) The root mean square deviation (RMSD) of solvated SARS-CoV2 Mpro protein backbone and in complex with Curcuma longa compounds C1, C2 and standard protease inhibitor lopinavir during 30 ns molecular dynamics simulation. (B) The root mean square deviation (RMSD) of solvated SARS-CoV2 Mpro whole protein and in complex with compounds C1, C2 and lopinavir during 30 ns molecular dynamics simulation. (C) The root mean square fluctuation (RMSF) values of solvated SARS-CoV2 Mpro protein and in complex with compounds C1, C2 and lopinavir plotted against residue numbers. (D) Plot of radius of gyration (Rg) during 30 ns molecular dynamics simulation of SARS-CoV2 Mpro protein and in complex with compounds C1, C2 and lopinavir. Unbound protein parameters are depicted in black color. Protein-ligand complex C1, C2 parameters are shown in green and blue color respectively. Protein-lopinavir complex is shown in red color.

