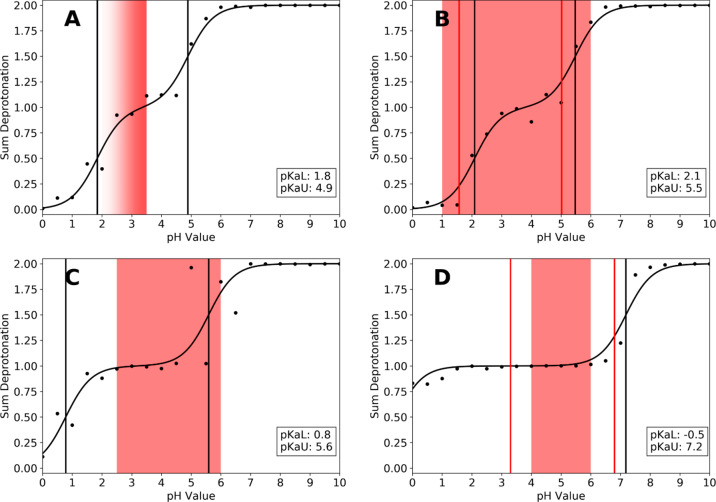
Figure 4.
Titration curves and predicted pKa values of the aspartate proteases chymosin (A), pepsin (B), cathepsin D (C), and HIV-1 protease (D), which were considered in this study. Activity ranges reported in the literature are shown as colored boxes (Table 2). Experimental (if available) and predicted pKa values are shown as red and black lines, respectively.

