Figure 7.

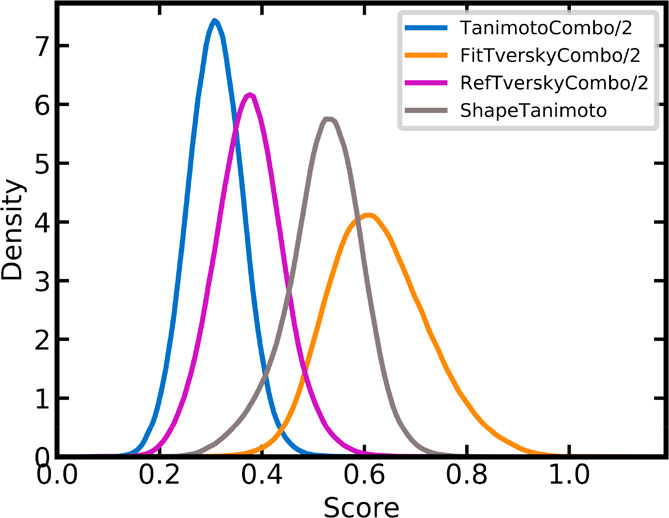
Density distributions of the four similarity metrics over all lists of scores obtained for all 280 queries. The TanimotoCombo, RefTverskyCombo, and FitTverskyCombo score values were scaled to the same range as the ShapeTanimoto score.

Density distributions of the four similarity metrics over all lists of scores obtained for all 280 queries. The TanimotoCombo, RefTverskyCombo, and FitTverskyCombo score values were scaled to the same range as the ShapeTanimoto score.