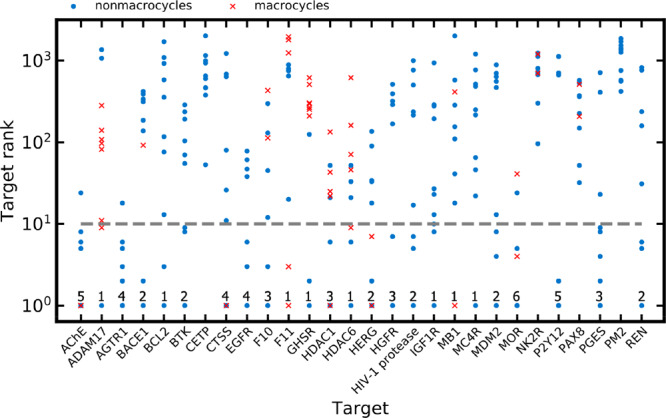
Figure 8.

Ranks assigned with the TanimotoCombo score to the target of interest for the 280 CSM queries. Note that the y-axis is on a logarithmic scale. The numbers reported at the bottom of the graph indicate the number of CSM queries for which the target of interest was assigned the rank of 1 (indicating perfect prediction); the dashed line indicates the rank of 10.
