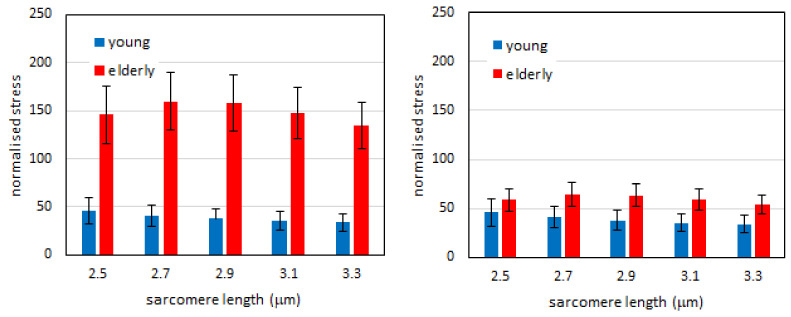
Figure 5.
Normalized extra-tension in young and elderly subjects. Left: the same fraction (α=3.3%) of ECM in CSA is considered in the two groups. Right: fraction of ECM (parameter α) is imposed at 3.3% of fibers CSA in young subjects and 8.2% in elderly subjects. Data are shown as mean value +/- SEM. The differences between elderly and young subjects at each sarcomere length level of the left histogram are statistically significant (p < 0.05), while the same differences in the right histogram are not.

