Figure 3.

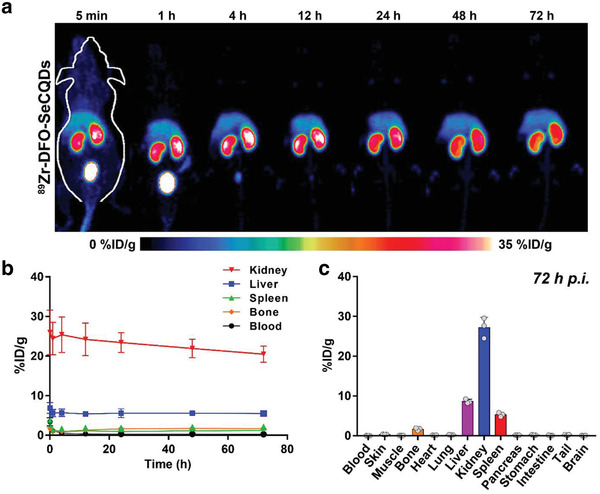
Biodistribution of SeCQDs in healthy mice. a) MIP PET images for 89Zr‐DFO‐SeCQDs in healthy ICR mice and b) corresponding ROI analysis. c) Ex vivo biodistribution. In (b,c), data represent means ± s.d. from three independent replicates.

Biodistribution of SeCQDs in healthy mice. a) MIP PET images for 89Zr‐DFO‐SeCQDs in healthy ICR mice and b) corresponding ROI analysis. c) Ex vivo biodistribution. In (b,c), data represent means ± s.d. from three independent replicates.