
Figure 5.
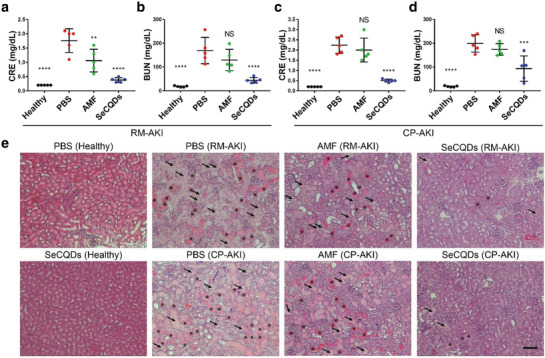
Blood serum biomarker measurements and H&E staining in AKI animal models. a) CRE and b) BUN serum concentrations of groups in the RM‐AKI animal model. c) CRE and d) BUN serum concentrations of groups in the CP‐AKI animal model. e) Histological changes in kidney sections were evaluated after H&E staining. Casts and damaged tubules are indicated with asterisks and arrows, respectively. Scale bar: 100 µm. In (a–d), data represents mean ± s.d. from five independent replicates. p values were calculated using one‐way ANOVA with Tukey's honest significant difference post‐hoc test (**p < 0.01, ****p < 0.0001).