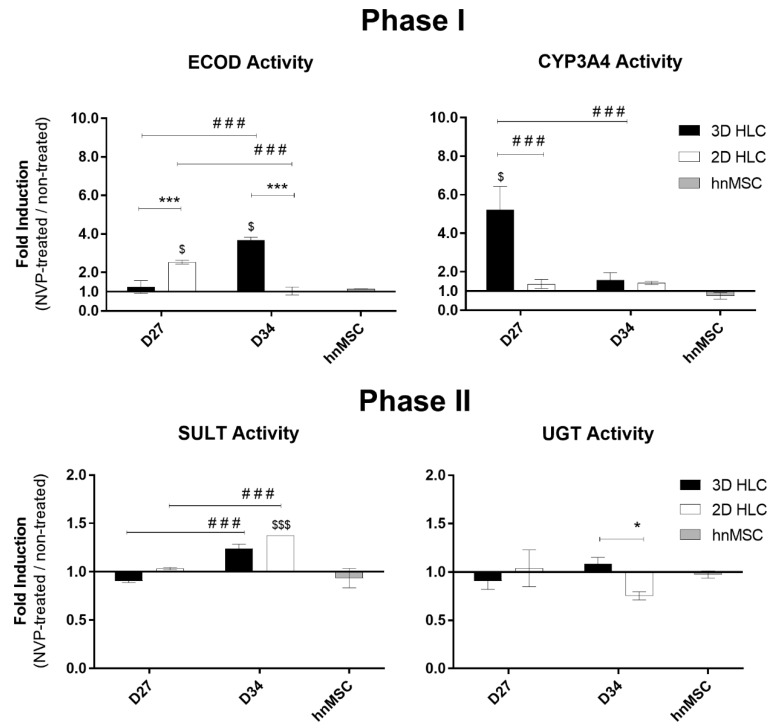
Figure 3.
Phase I and Phase II enzymatic induction in 3D- and 2D-HLCs after 3 (D27) and 10 days (D34) of NVP treatment. The data for hnMSC, cultured in monolayer and exposed to NVP for 3 days, are presented as negative control. * p < 0.05 and *** p < 0.001 relative to 2D-HLCs, $ p < 0.05 and $$$ p < 0.001 relative to non-treated and ### p < 0.001 relative to D27 of culture. The data (Mean ± SD, n = 3) are represented as fold induction in NVP-treated cells relative to non-treated cells.

