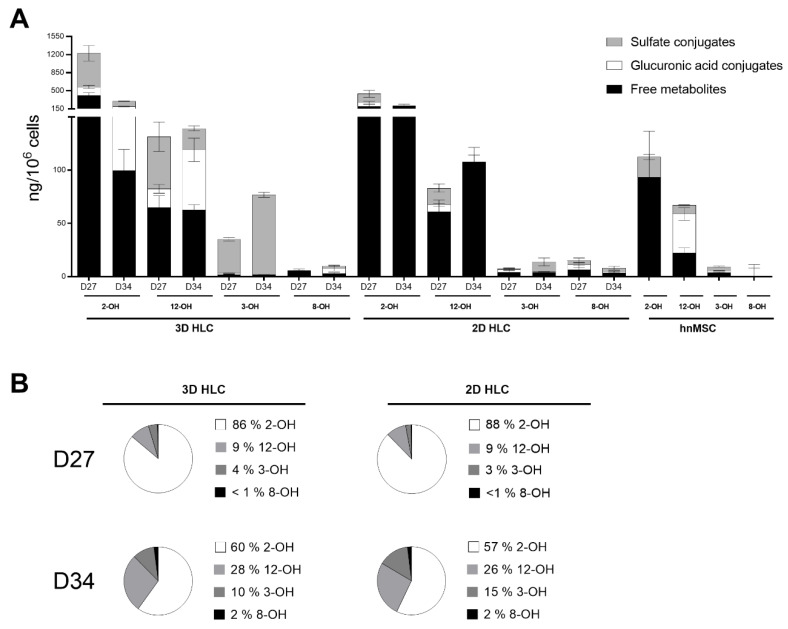
Figure 4.
(A) Levels of NVP Phase I and II metabolites in 3D- and 2D-HLCs after 3 (D27) and 10 days (D34) of NVP treatment. hnMSC cultured in monolayer and exposed to NVP for 3 days are also shown and (B) relative proportions of total NVP metabolites (free metabolites + sulfate conjugates + glucuronic acid conjugates) at D27 and D34. The data (Mean ± SD, n = 3) are normalized to total cell number.

