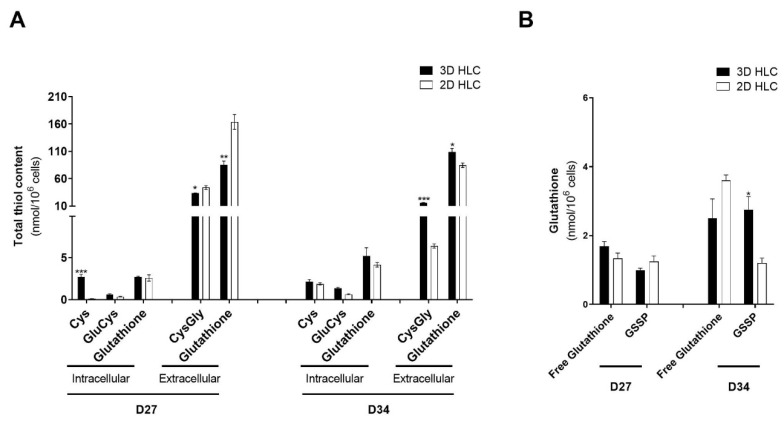
Figure 5.
Glutathiolomic analysis of 3D- and 2D-HLCs at D27 and D34. (A) Total intracellular availability for cysteine (Cys), glutamylcysteine (GluCys) and glutathione and total extracellular levels of cysteinylglycine (CysGly) and glutathione; (B) Intracellular levels of protein-bound glutathione (GSSP) and free glutathione; * p < 0.05, ** p < 0.01 and *** p < 0.001 relative to 2D-HLCs. The data are represented as Mean ± SD, n = 3.

