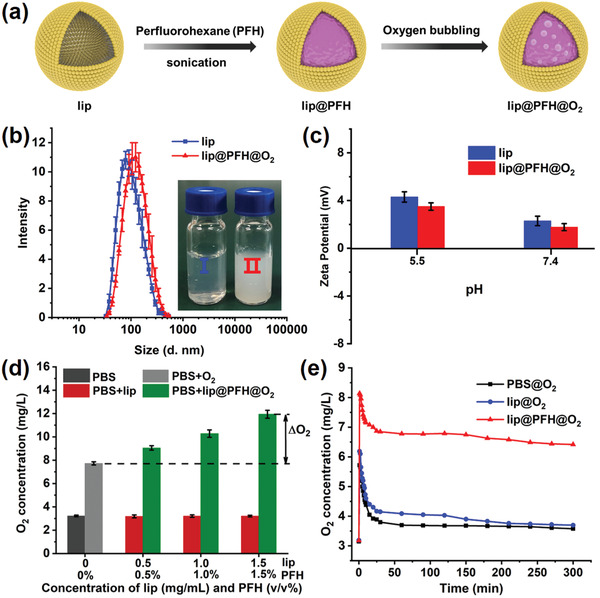
Figure 1.

a) Schematic diagram of preparation process of lip@PFH@O2; b) Hydrodynamic diameter of lip and lip@PFH@O2. Inset: photos of lip and lip@PFH@O2 solution; c) Zeta potentials of lip and lip@PFH@O2 at different pH values; d) The measurement of oxygen loading capacity of lip@PFH@O2. Oxygen concentration in 5 mL phosphate buffered saline (PBS, 10 × 10−3 m) before and after adding 5 mL of lip@PFH@O2 with different concentrations. ΔO2: Enhanced O2 concentration; e) The oxygen concentration changes of PBS solution after adding PBS@O2 solution, lip@O2 solution, and lip@PFH@O2 solution, respectively.
