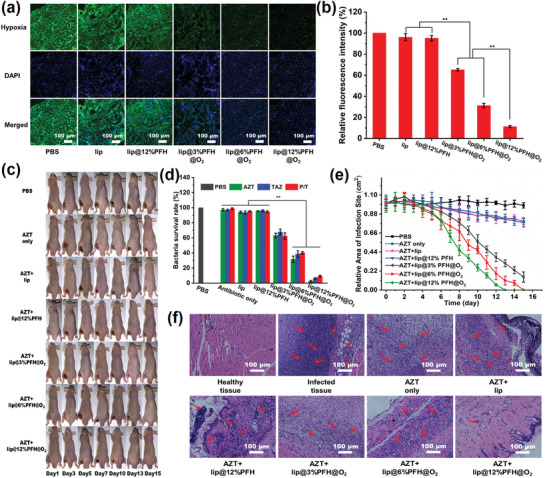
Figure 3.

a) Representative immunofluorescence images of P. aeruginosa biofilm stained by the hypoxyprobe. The nuclei and hypoxia area are stained with DAPI (blue) and anti‐pimonidazole antibody (green), respectively; b) Quantification of biofilm hypoxia for different groups shown in immunofluorescence images of biofilm in (a); c) The representative photographs of P. aeruginosa (108 cfu mL−1) infected mice within 15 d after different treatments; d) Related quantitative results of standard plate counting assay after different treatments with same antibiotic concentration (1 mg mL−1) in the subcutaneous P. aeruginosa biofilm infection model; e) The area change of P. aeruginosa biofilm infection sites of the mice after different treatments in the subcutaneous P. aeruginosa biofilm infection model; f) Histological photographs of infected skin tissues after different treatments, the inflammatory cells marked by red arrows (on 15th day). Scale bar: 100 µm.
