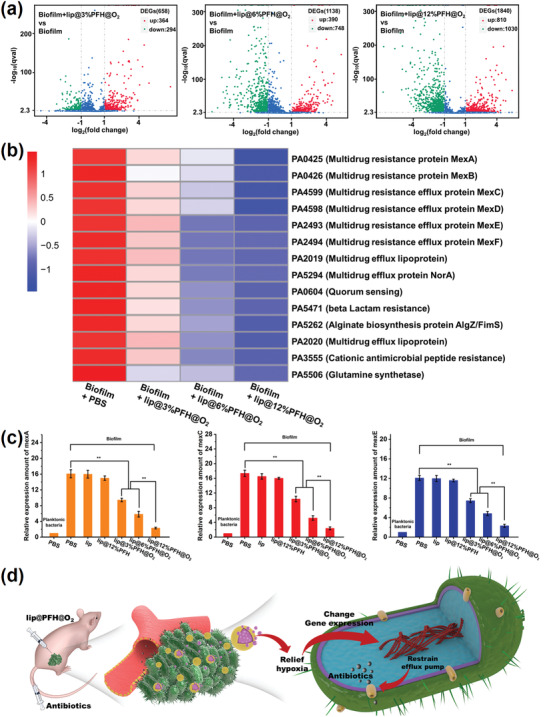
Figure 5.

a) Volcano plot of gene expression differences between P. aeruginosa biofilm and P. aeruginosa biofilm treated with lip@3%PFH@O2, lip@6%PFH@O2, or lip@12%PFH@O2, respectively; b) Heat cluster plot of gene expression differences among P. aeruginosa biofilm treated with PBS, lip@3%PFH@O2, lip@6%PFH@O2, and lip@12%PFH@O2; c) The qRT‐PCR gene detection of relative expression amount of mexA, mexC, and mexE in P. aeruginosa bacteria in biofilm treated with different groups in vitro; d) The schematic diagram of treatment process of biofilm infection by using the antibiotics combining with lip@PFH@O2.
