Figure 4.

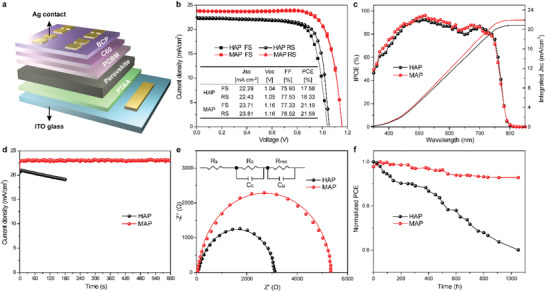
Device architecture and solar cell performance of MAP and HAP devices. a) Device configuration of the planar p‐i‐n perovskite solar cell. b) J–V characteristic curves of champion devices with reverse and forward scans at rate of 10 mV s−1, measured under the solar simulator of AM 1.5G, photovoltaic parameters listed in insert table. c) IPCE spectra and their integrated current densities. d) Steady‐state current density. e) Nyquist plots at a potential bias of 1.0 V, and frequency range from 10 to 105 Hz, in the dark. The inset is the equivalent circuit model. f) Long‐term stability tests in air atmosphere under dark at 25–30 °C and 30–50% RH without encapsulation.
