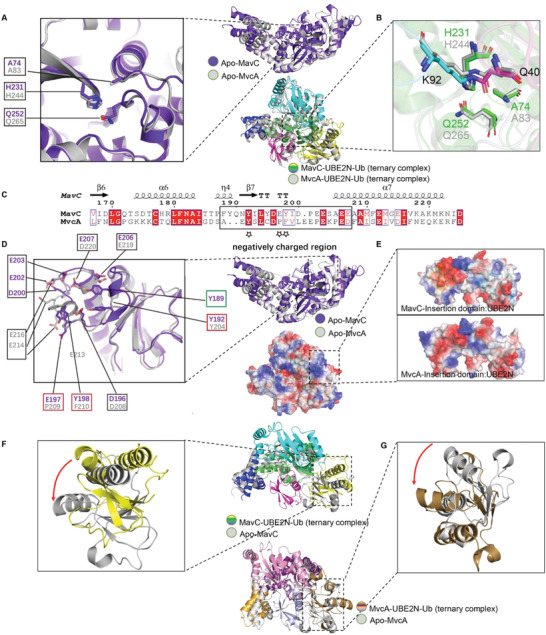
Figure 7.

Structural comparison and analysis of Insertion domains and catalytic triads of MavC and MvcA. A,B) Superimposition of the catalytic triads (panel A) of apo MavC (purple) and apo MvcA (gray). Superimposition of the catalytic triads (panel B) of MavC–UBE2N–Ub (colorized) and MavC–UBE2N–Ub (gray) ternary complexes. The catalytic triads of MavC and MvcA are shown as sticks. C) Structure‐based sequence alignment of the loop between β6 and α7 that contains negatively charged amino acids. The negatively charged region is boxed by black rectangle, and the key residues involved in the interactions between MavC and UBE2N are labeled by stars. D,E) Structural comparison of Insertion domains of MavC and MvcA. The residues involved in the formation of the negatively charged region are shown as sticks, corresponding residues in MavC and MvcA are labeled by black boxes, and the key residues are highlighted by red boxes (panel D). Superimposition of the Insertion domains of MavC–UBE2N–Ub and MavC–UBE2N–Ub ternary complexes. The Insertion domains of MavC and MvcA are shown as electrostatic surface (panel E). F,G) Superimposition of Insertion domains of MavC–UBE2N–Ub ternary complex (colorized) and apo MavC (gray) (panel F), and MvcA–UBE2N–Ub ternary complex (colorized) and apo MvcA (gray) (panel G). The rotation of the Insertion domains from their position in the apo protein to their position in ternary complex is indicated by an arrow.
