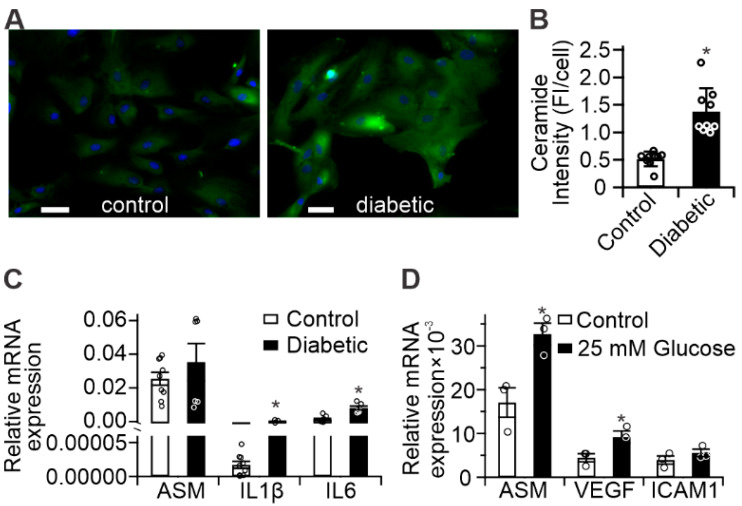
Figure 2.
Diabetes-induced pro-inflammatory changes in human RPE (A) Representative images of control- and diabetic-derived retinal pigment epithelial (RPE) cells showing ceramide (green) and nuclear staining (blue). Scale bars = 50 µm; (B) Quantitation of ceramide-staining fluorescence intensity from panel (A). n = 9, error bars = S.D., * p < 0.05; (C) Inflammatory gene expression in diabetic-derived RPE (black bars) compared to control (white bars); (D) Upregulation of inflammatory gene expression in control RPE treated with 25 mM glucose for 72 h (black bars) compared to untreated cells (white bars). * p < 0.01, n = 6.

