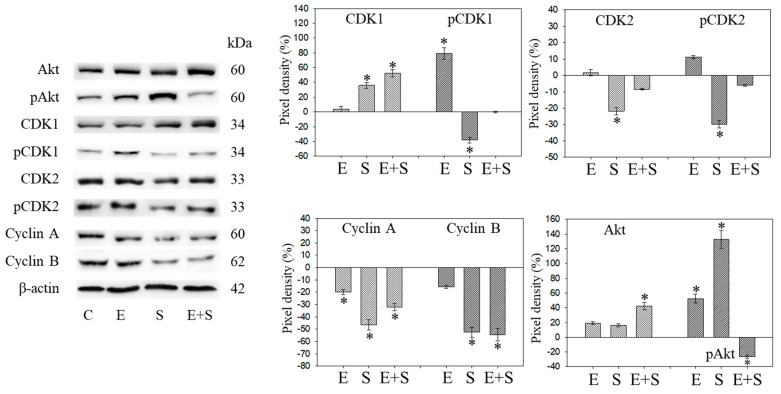
Figure 9.
Protein profile of cell cycle regulating proteins (Akt, CDKs, Cyclins) after long-term exposure to 0.5 nM everolimus (E) or 2.5 µM sulforaphane (S) or 0.5 nM everolimus + 2.5 µM sulforaphane (E + S) to synchronized RT112 tumor cells. Controls (C) received cell culture medium alone. One representative of three separate experiments is shown. Each protein analysis was accompanied by a β-actin loading control. One representative internal control is shown. The right panel shows the results of the pixel density analysis. The ratio of protein intensity/β-actin intensity was calculated and expressed as a percentage of the controls, set to 100%. * indicates significant difference to controls, p ≤ 0.05.

