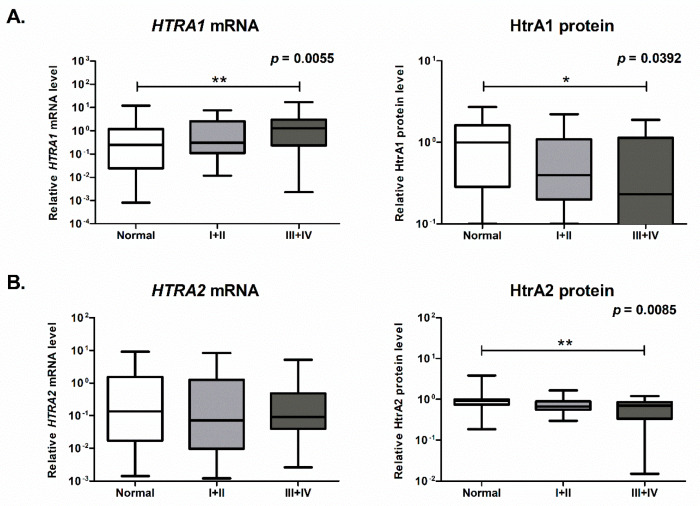
Figure 2.
Association of expression of the HTRA1 (A) and HTRA2 (B) genes with metastatic progression of CRC. The plot boxes represent the relative mRNA level of the HTRA1/2 genes and the relative levels of the HtrA1/2 proteins in unchanged colorectal mucosa (Normal) and tumor tissue of locally advanced lesions (combined stages I and II according to the TNM classification system) and tumor tissue (from primary lesions) derived from patients with metastatic disease (combined stages III and IV). Statistical significance was determined by the Kruskal–Wallis test (the p-values are presented in the top right corner of the graphs) and the Dunn’s multiple comparison post hoc test. * p < 0.05, ** p < 0.01.

