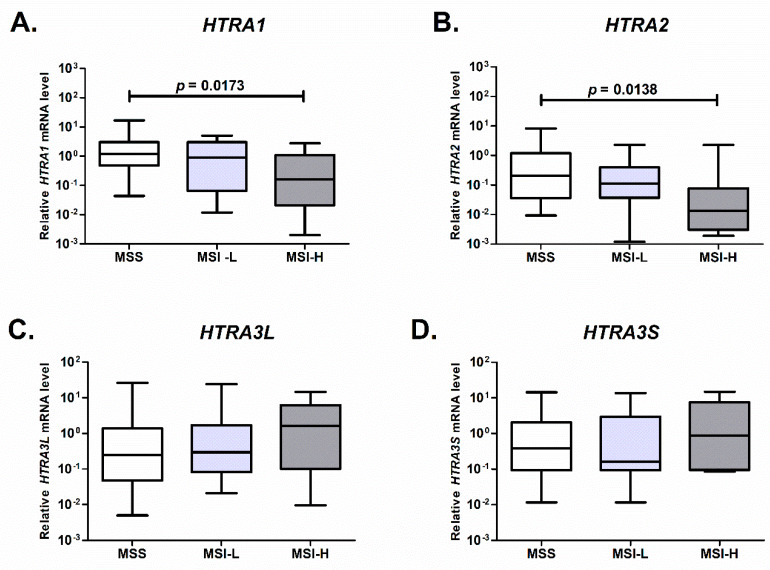
Figure 4.
Association between expression of the HTRA1 (A), HTRA2 (B), and HTRA3 genes (C,D) genes and microsatellite status of colorectal tumors. The plot boxes present the relative mRNA levels of the HTRA genes in MSS (n = 31), MSI-L (n = 23) and MSI-H (n = 17) colorectal cancers. Statistical significance was determined by the Mann-Whitney U test.

