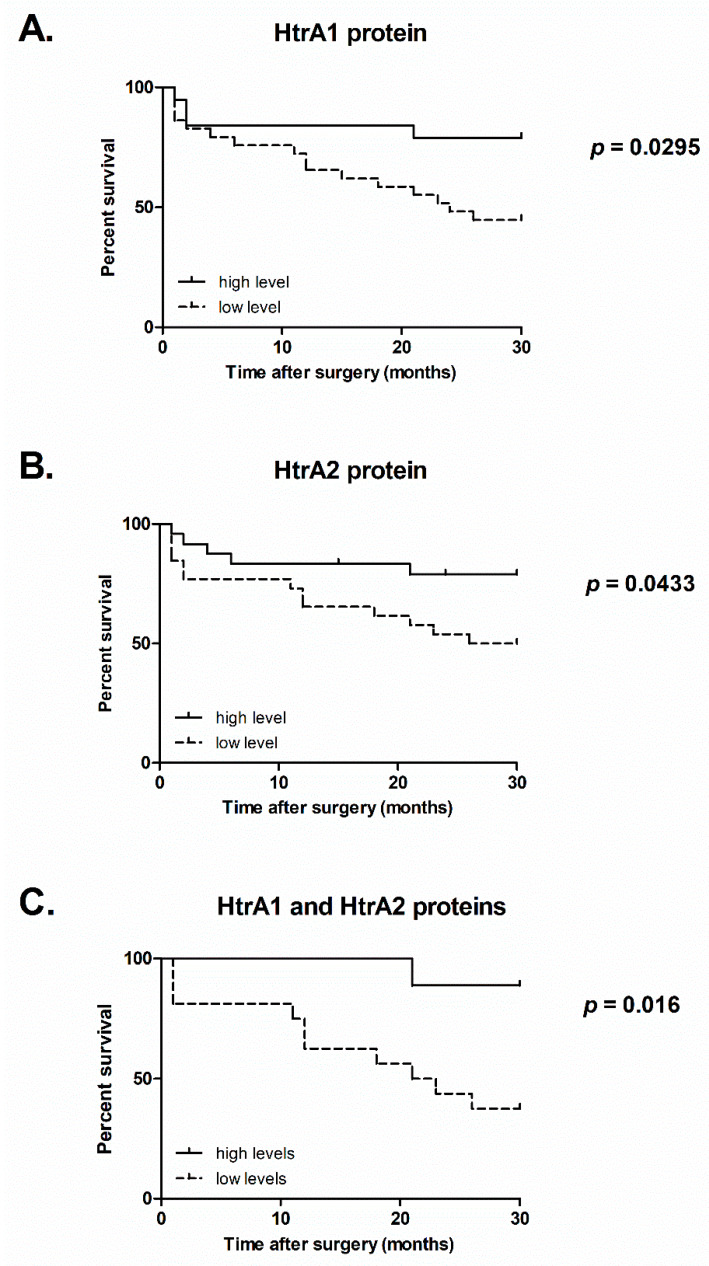
Figure 5.
Analysis of the CRC patients’ survival in relation to protein levels of HtrA1 (n = 48) (A), HtrA2 (n = 50) (B), and levels of both, HtrA1 and HtrA2 proteins (n = 25) (C). Statistical significance was evaluated using log-rank Mantel-Cox test and p values are presented. The discrepancy between numbers of CRC patients, included in the survival analysis in relation to HtrA1 level (n = 50) and HtrA2 level (n = 48) is due to the fact that some tumor tissue lysates degraded markedly and were not processed for the immunoblotting-based analysis of the HtrA2 protein. Analysis of survival in relation to levels of both proteins simultaneously were performed on a group of 25 individuals who had low levels of both HtrA1 and HtrA2 proteins (n = 16) or high levels of the HtrA proteins (n = 9). The CRC patients with low level of HtrA1 and, simultaneously, high level of HtrA2, or vice versa were not included in the analysis.

