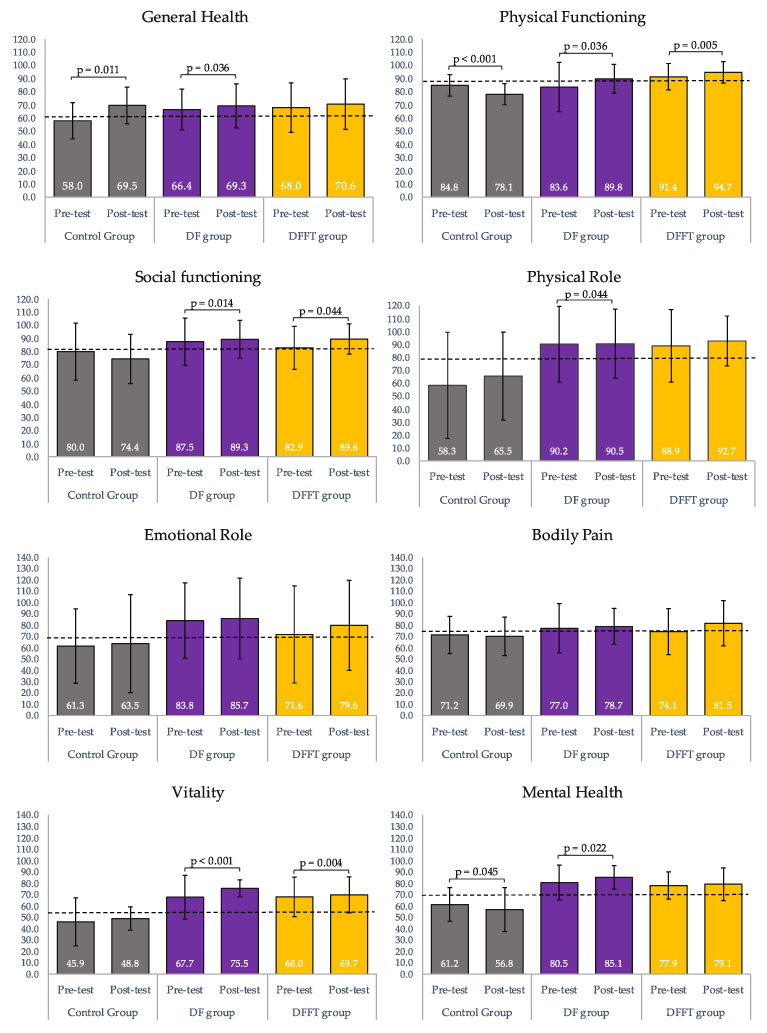
Figure 2.
Changes in HRQoL dimensions from baseline to post-intervention within the study groups (mixed factorial ANOVA, Bonferroni post-hoc test for differences pre-post within the groups). DF group = Dance Fitness group; DFFT = Dance Fitness and functional strength training group; Data are expressed as mean (M) and standard deviation (SD) based on marginal means and the following baseline leves of reference represented by discontinued line: GH = 62.14, PF = 86.30, SF = 80.68, PR = 80.45, ER = 69.05, BP = 74.07, V = 56.8, MH = 70.07.

