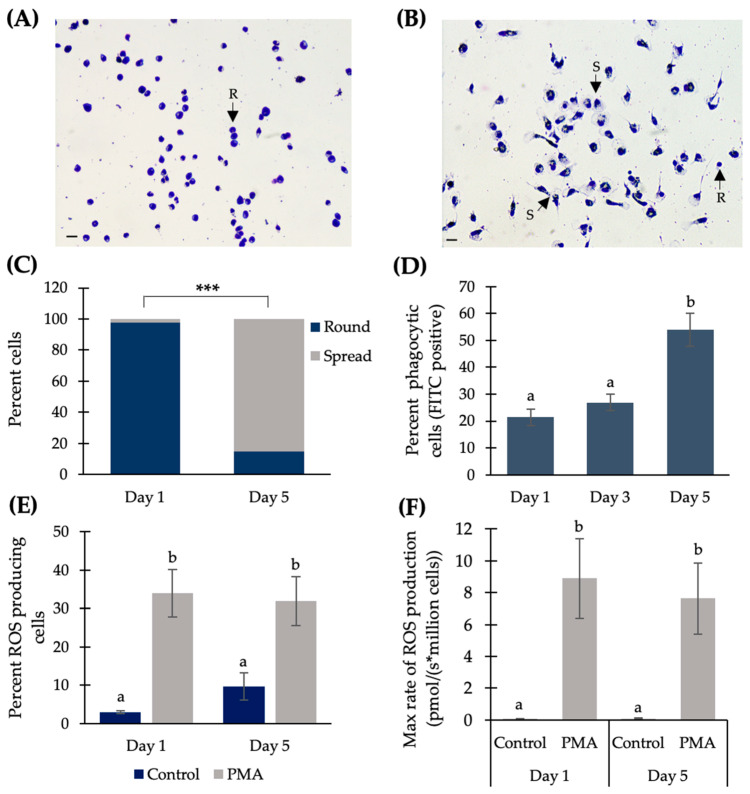
Figure 1.
Influence of culture time on the morphology and function of Atlantic salmon adherent head kidney leukocytes (HKLs). Representative images of Giemsa-stained HKLs cultured for (A) 1 day and (B) 5 days. Arrows indicate spread cells (S; cells with pseudopodia present) and non-spread, round cells (R; cells with no pseudopodia present). Scale bar on the bottom left of panel (A) and panel (B) is equal to 20 μm. (C) Mean percentage of round vs. spread cells in Day 1 and Day 5 cultures, where *** indicates a significant difference of p < 0.0001 by chi-square test. (D) Percentage of phagocytic HKLs on Day 1 and Day 5 of culture. (E) Percentage of HKLs producing reactive oxygen species (ROS), as determined by flow cytometry. (F) Maximum rate of ROS production (pmol/(s*million cells)), as determined by Oroboros respirometry. Day 1 control value: 0.089 pmol/(s*million cells); Day 5 control value: 0.105 pmol/(s*million cells). Data shown as the mean +/− SE; different lowercase letters indicate a significant difference of p < 0.05 as determined by a repeated measures one-way ANOVA for phagocytosis data and a paired Student’s T-test for ROS data, n = 4. PMA: phorbol myristate acetate.

