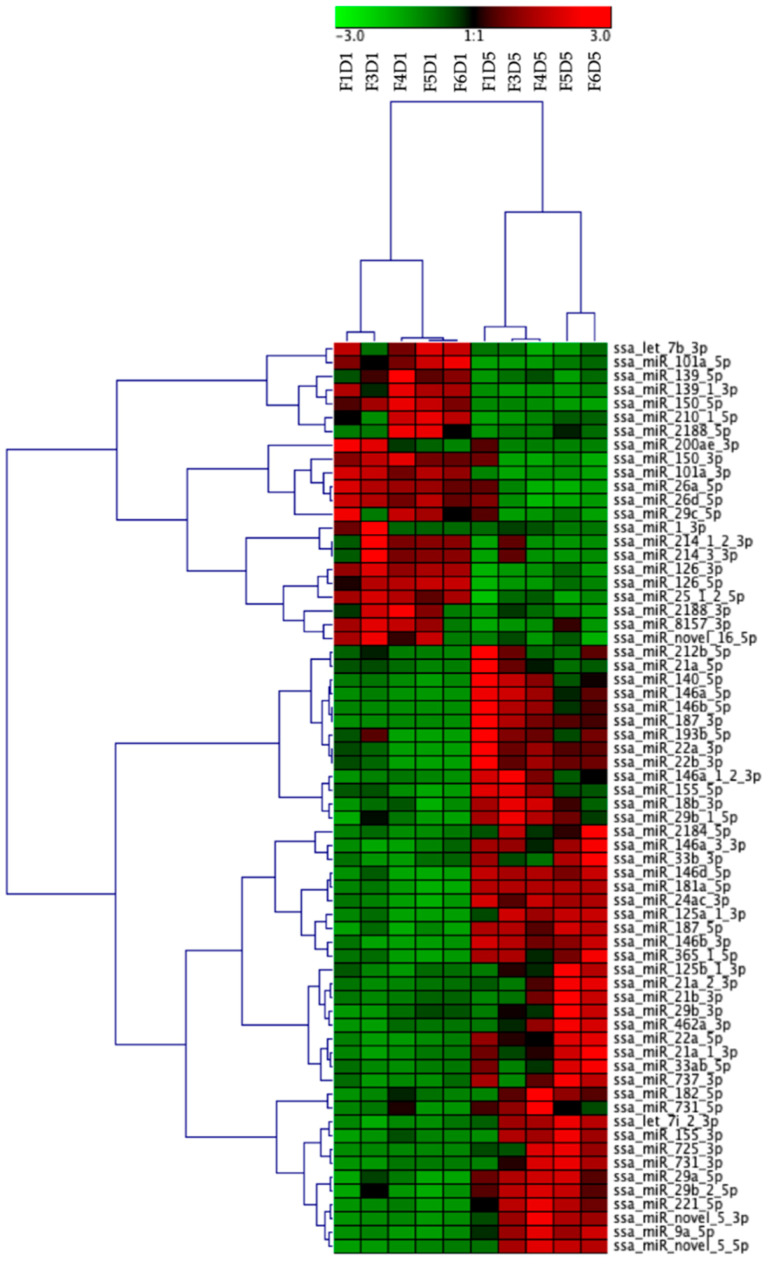
Figure 3.
Results from hierarchical clustering of differentially expressed (DE) miRNAs from Day 1 and Day 5 HKLs shown as a heatmap. miRNAs counts per million were normalized and clustered using Pearson correlation and complete linkage hierarchical clustering. F indicates fish number; D indicates Day 1 or Day 5 (for example, F1D1 is Fish 1 Day 1).

