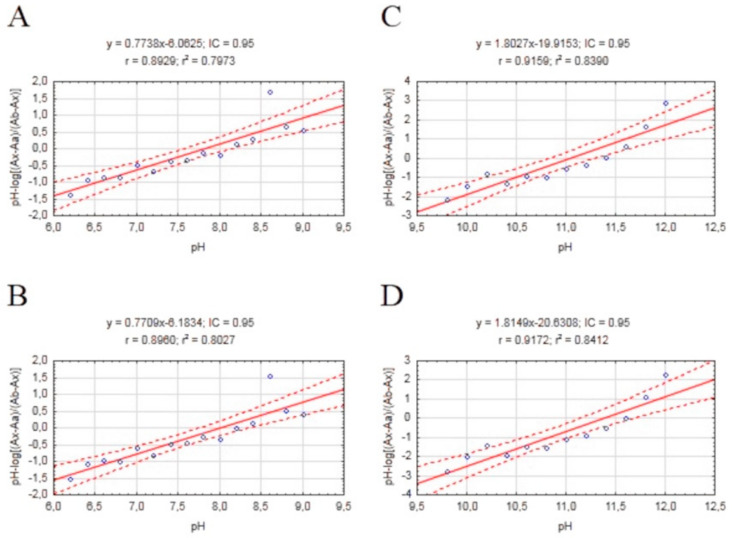
Figure 4.
Scatterplots of mathematical formula results obtained for our compound with a regression equation. (A) Plot pH vs. pH-log(Ax−Aa)/(Ab−Ax) 310/336 nm; (B) Plot pH vs. pH-log(Ax−Aa)/(Ab−Ax) 336/310 nm; (C) Plot pH vs. pH-log(Ax−Aa)/(Ab−Ax) 310/336 nm; (D) Plot pH vs. pH-log(Ax−Aa)/(Ab−Ax) 336/310 nm.

