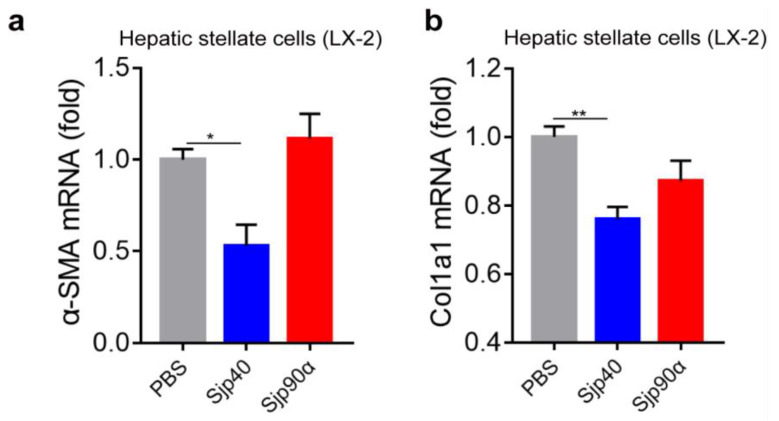
Figure 7.
Different effects of rSjp40 and rSjp90α on α-SMA and COL1A1 expression in LX-2 cells. Transcript expression levels of α-SMA (a) and COL1A1 (b) in LX-2 cells co-cultured with PBS, rSjp40 and rSjp90α, respectively. β-actin was used as the internal standard for normalization. Data are expressed as the mean ± SEM (n = 8 each group), ** p < 0.01, * p < 0.05, compared with PBS control.

