Figure 2.
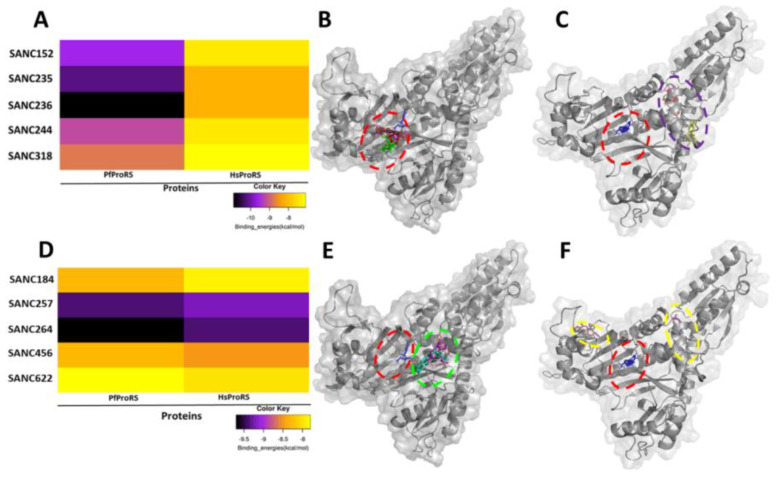
Binding energy (kcal/mol) heat maps and binding modes of the selected orthosteric and allosteric hit compounds on PfProRS and HsProRS. (A) Binding energies of orthosteric hit compounds. Selected orthosteric hits binding at the PfProRS active site are shown at the left side of the heat map. Binding energy increases from black to yellow. A black colour shows good binding energy. (B) Binding modes of identified orthosteric hit compounds on PfProRS. (C) The binding modes of the selected orthosteric hits in HsProRS. In HsProRS, selected orthosteric ligands do not bind the targeted active and allosteric sites. (D) Binding energies of allosteric hit compounds. Selected allosteric hits binding at the PfProRS allosteric site are shown at the left side of the heatmap. A black colour shows good binding energy. (E) Binding modes of identified allosteric hit compounds on PfProRS. (F) Binding poses of identified allosteric hits in HsProRS. Selected allosteric hits do not bind the targeted active and predicted allosteric site in HsProRS. Adenosine binding pose at the active site is shown in blue sticks. The active site is shown in red ellipse while the identified allosteric site is shown in green ellipse. Binding modes of identified orthosteric and allosteric hits on HsProRS are shown in purple and yellow ellipses, respectively.

