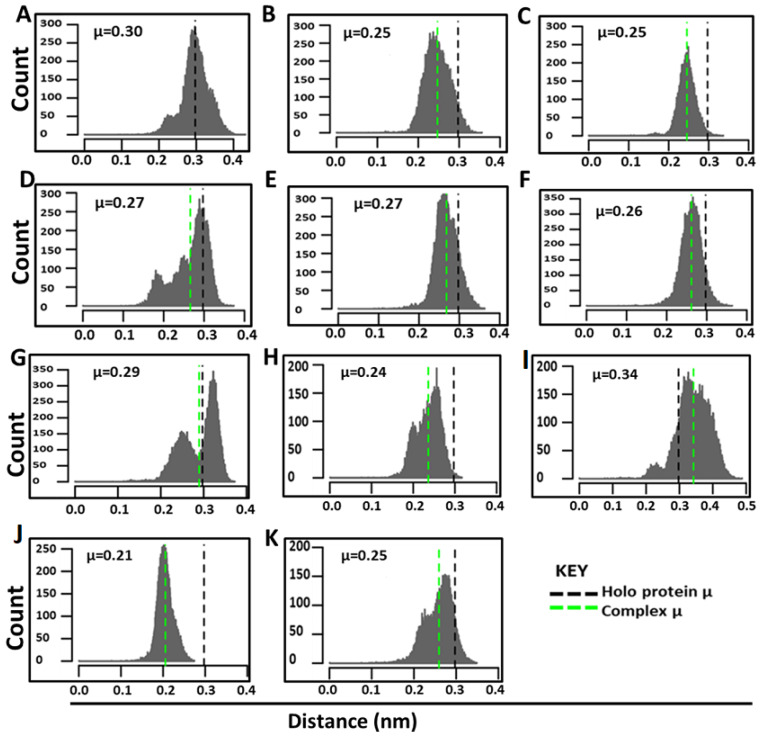
Figure 5.
Backbone RMSD distribution plots for PfProRS ligand-bound complexes. Conformational flexibility can be assessed by comparing the backbone RMSD distribution of each ligand-bound complex and the holo protein. Comparison of the mean (µ) of the holo protein (black dashed line) to each ligand complex (green dashed line) demonstrates the shift in conformation distribution of the complexes during the 200 ns MD simulation. σ is the standard deviation. (A) Holo system (PfProRS-ADN), (B) PfProRS-SANC152 complex, (C) PfProRS-SANC235 complex, (D) PfProRS-SANC236 complex, (E) PfProRS-SANC244 complex, (F) PfProRS-SANC318 complex, (G) PfProRS-SANC184 complex, (H) PfProRS-SANC257 complex, (I) PfProRS-SANC264 complex, (J) PfProRS-SANC456 complex and (K) PfProRS-SANC622 complex.

