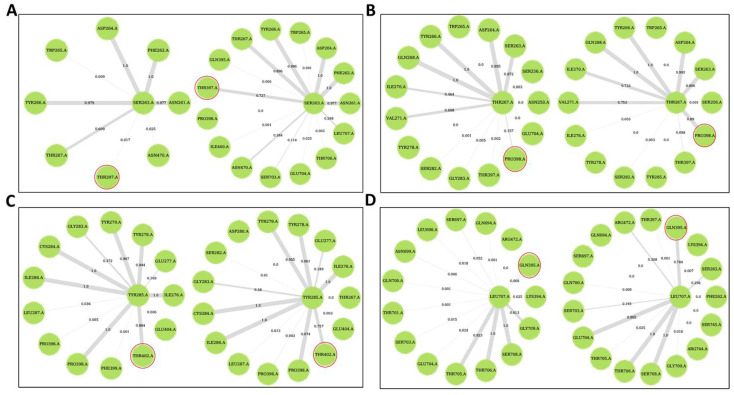
Figure 12.
Frequency of contacts at the determined allosteric site in the holo (left sub-figure) and the ligand-bound complexes (right sub-figure). The allosteric site residue is shown in the middle of each contact map while residues at the ATP binding TXE loop are circled in red. (A) Contact frequency between residue Ser263 and Thr397 (B) Contact frequency between residue Thr267 and Pro398, (C) Contact frequency between residue Tyr285 and Thr402 and (D) Contact frequency between residue Leu707 and Gln395.

