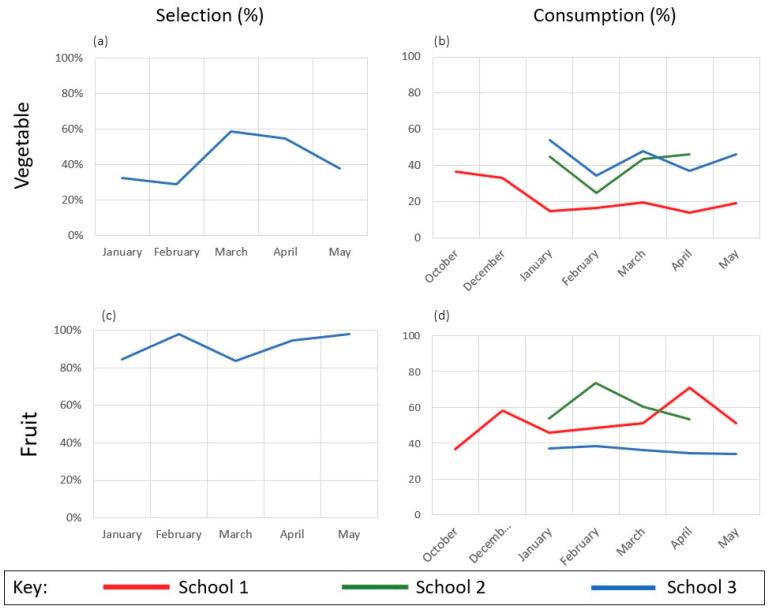
Figure 2.
Monthly percent of fruit and vegetable selection and consumption. Note. Original selection frequencies displayed for vegetable (a) and fruit (c) components (for School 3 only). Estimated marginal means (adjusted for gender, grade, entrée consumption, and fruit offering) displayed for consumption of vegetable (b) and fruit (d).

