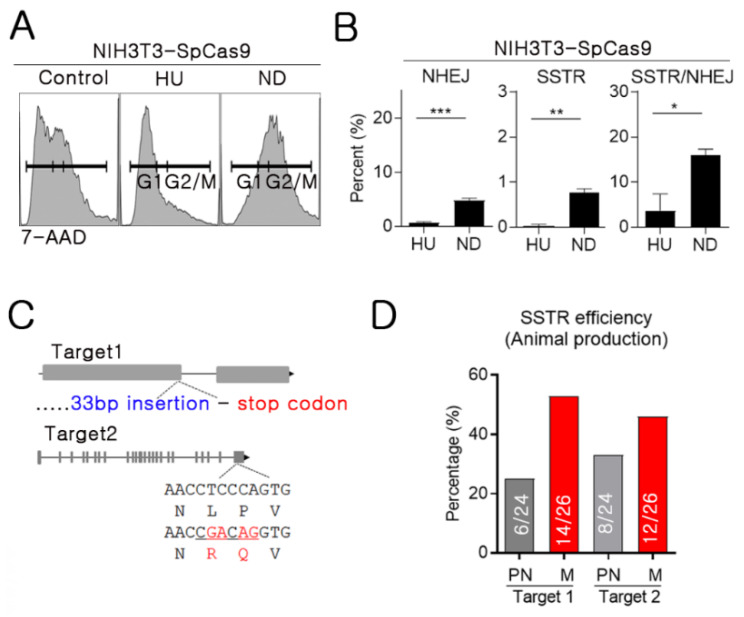
Figure 3.
NHEJ and SSTR analysis throughout the cell cycle. (A) Confirming cell cycle synchronization using flow cytometry of hydroxyurea- and nocodazole-treated cells. Anti-7-AAD was used for detection. HU: hydroxyurea, ND: nocodazole. (B) NHEJ and SSTR efficiency were calculated using data from deep sequencing-based analysis (% of NHEJ or KI reads / total reads). (C) Mouse generation with SSTR strategy; 33 bp insertion (Target 1) and nucleotide alteration (Target 2) (D) SSTR efficiency was calculated (% of KI pups per total produced pups). Grey bar: electroporation at PN (3 p.m., 25 h after hCG injection). Red bar: electroporation at mitosis (7 p.m., 29 h after hCG injection).

