Figure 1.
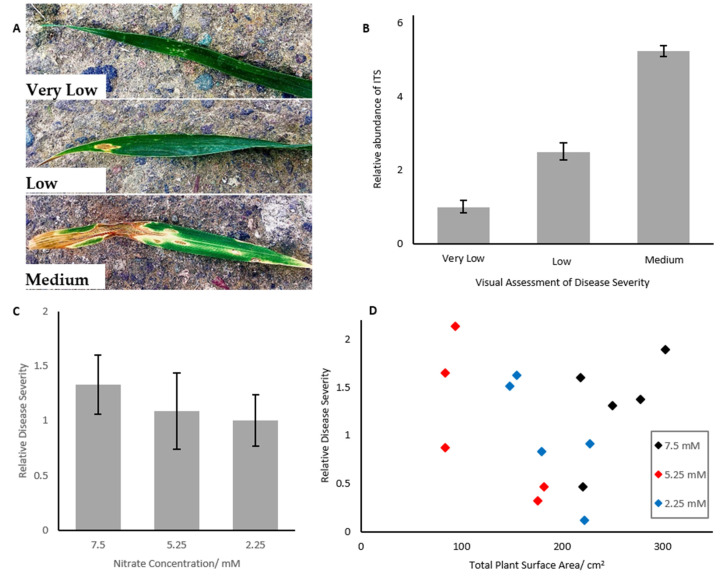
(A) Representative images of Very Low, Low and Medium levels of Septoria infected wheat leaves. (B) Abundance of Septoria ITS region in wheat samples infected with Septoria. ITS abundance increases with increasing disease severity. Error bars represent ± 1 standard deviation. n = 3. Different letters represent statistically significantly different means (p < 0.05). Means compared via ANOVA, n = 3 (C) Wheat grown for 35 days under differential nitrogen concentrations did not show significantly different levels of Septoria (p < 0.05), analysed by expression of the Septoria ITS region. Error bars represent ± 1 SEM. Different letters represent statistically significantly different means (p < 0.05). Means compared via ANOVA, n = 5. (D) Septoria severity in wheat did not correlate with total surface area of the plant for wheat grown for five weeks under differential nitrogen treatment. Regression analysis was used to determine correlation, and ANOVA was used to determine that the slope coefficient was not significantly different from 0 (p = 0.682).

