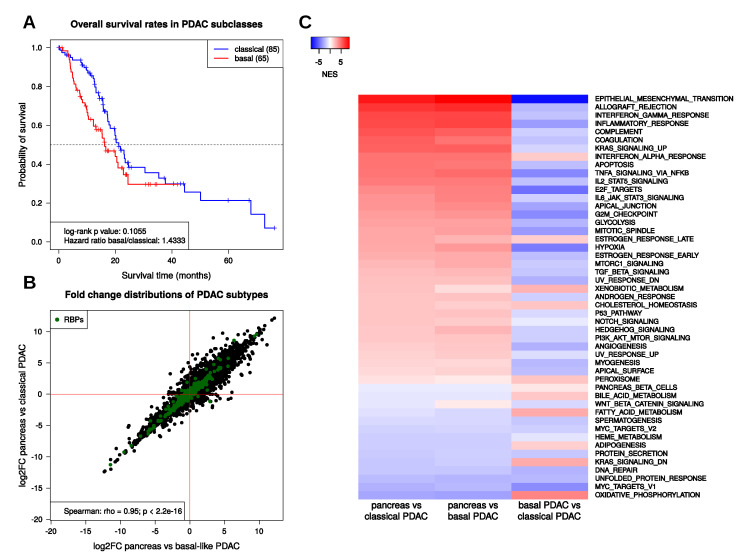
Figure 2.
PDAC subtype properties. (A) Kaplan–Meier-curves showing overall survival rates for classical (blue) and basal-like (red) PDAC. (B) RNA expression changes of protein-coding genes in classical and basal-like PDAC subtypes compared to normal pancreas samples. Green points mark RNA binding proteins (RBPs). (C) Heatmap showing normalized enrichment scores (NES) obtained from gene set enrichment analyses (GSEA) of the 50 MSigDB hallmark gene sets using fold changes obtained by the comparisons of pancreas against classical PDAC (first column), pancreas against basal-like PDAC (second column), and basal-like against classical PDAC (third column).

