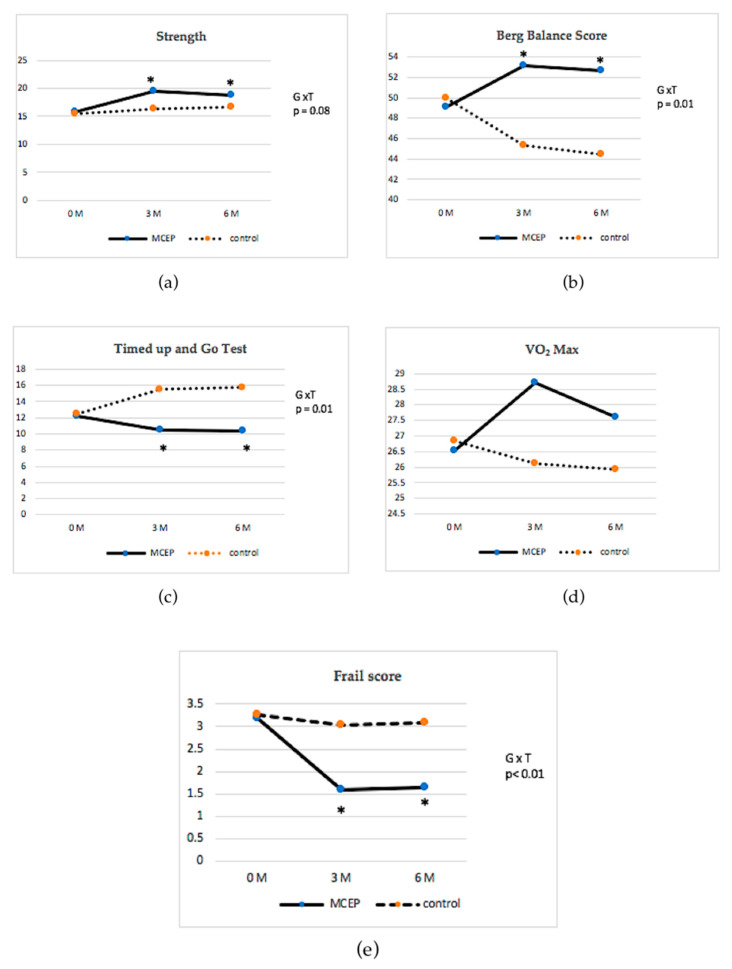
Figure 2.
Change in physical performance from baseline to the end of the study between the intervention and control groups with interaction effects of group x time as follows: (a) change in strength; (b) change in Borg Balance Score; (c) change in Timed Up and Go test; (d) change in Vo2 Max; and (e) change in frailty score. Values are mean ± standard deviation. * = Significantly different at p < 0.05.

