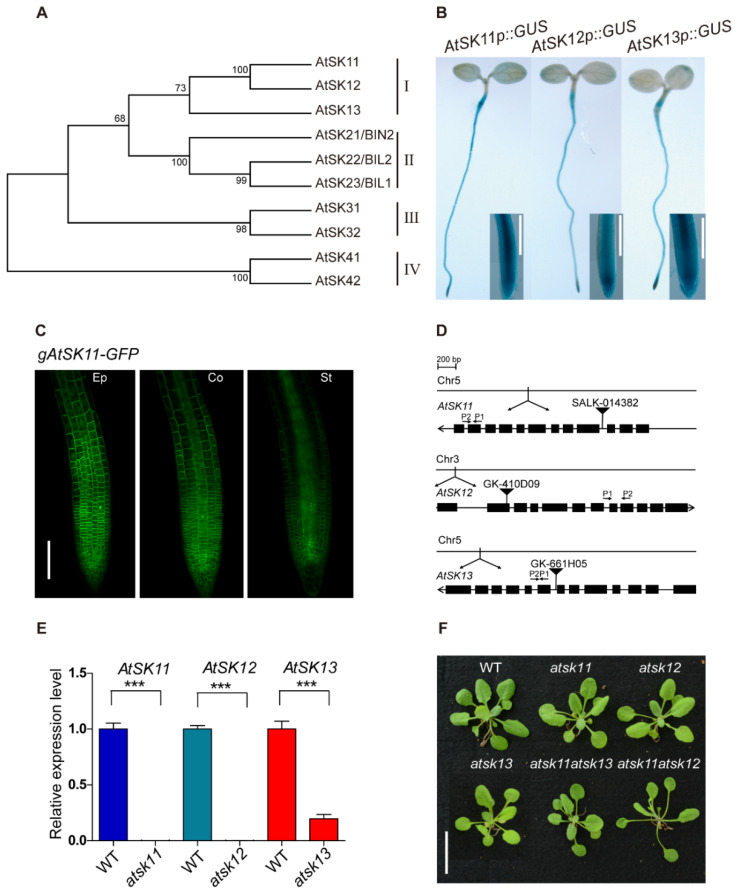
Figure 1.
GLYCOGEN SYNTHASE KINASE 3 (GSK3) members AtSK11, AtSK12, and AtSK13 are highly expressed in the root tip. (A) Phylogenetic analysis of the Arabidopsis GSK3-like kinase gene family. Amino acid sequences were downloaded from the TAIR database, aligned with Clustal W. The evolutionary history was inferred using the maximum parsimony method. The percentages of replicate trees in which the associated taxa clustered together in the bootstrap test (1000 replicates) are shown. The evolutionary tree was constructed with MEGA7. (B) GUS staining of 5-day-old AtSK11p::GUS, AtSK12p::GUS, and AtSK13p::GUS seedlings. The rectangles show magnified views of the root tip images. Bar = 0.2 mm. (C) Subcellular localization of AtSK11-GFP in root tip cells. Images show epidermal (Ep), cortex (Co), and stele (St) cells in the root tips of 5-day-old gAtSK11-GFP transgenic seedlings. Bar = 0.1 mm. (D) Diagram of the T-DNA insertions in atsk11, atsk12, and atsk13. The qRT-PCR primer locations are labeled with arrows in the figures; P1 indicate forward primers and P2 indicate reverse primers. (E) Expression levels of AtSK11, AtSK12, and AtSK13, as detected by qRT-PCR, data were replicated in three times. Error bars indicate SD. Student’s t-test was used to determine the significance of difference between wild-type (WT) and mutant. Significant levels: *** p < 0.001. (F) Phenotypes of 3-week-old WT, atsk11, atsk12, atsk13, atsk11atsk12, and atsk11atsk13 rosettes. Bar = 2 cm.

