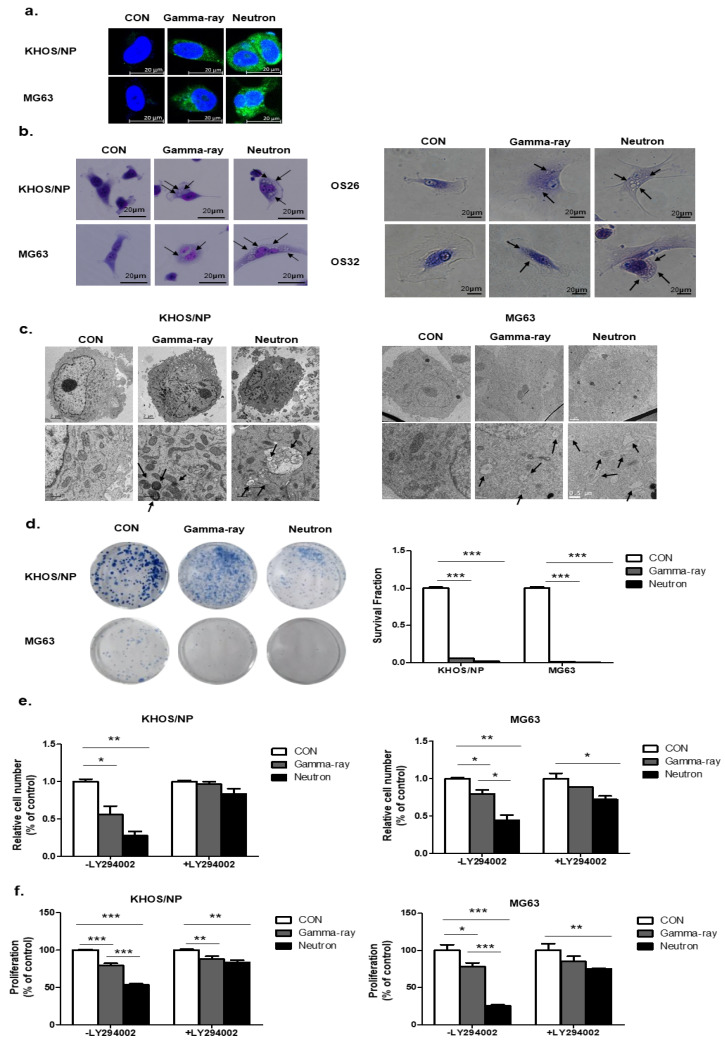
Figure 2.
Relationship between autophagy and cell survival after exposure to gamma-rays and neutrons. (a) Cyto-ID staining with and without radiation treatment in the KHOS/NP and MG63 cells. (b) Cells were stained with Giemsa (10% in PBS), washed, and imaged under a Nikon Eclipse Ts2R-FL microscope (magnification, 40×). Black arrows show vacuoles. An image representative of two independent experiments is shown. (c) Autophagy observed by transmission electron microscopy in irradiated OS cells. (d) Survival curves of the pharmacological promotion of autophagy on the sensitivity of OS cells to high-LET (high linear energy transfer) radiation; *** p < 0.001. The proliferation of OS cell lines were estimated by trypan blue assay (e) and MTT (f); * p < 0.05, ** p < 0.01, *** p < 0.001.

