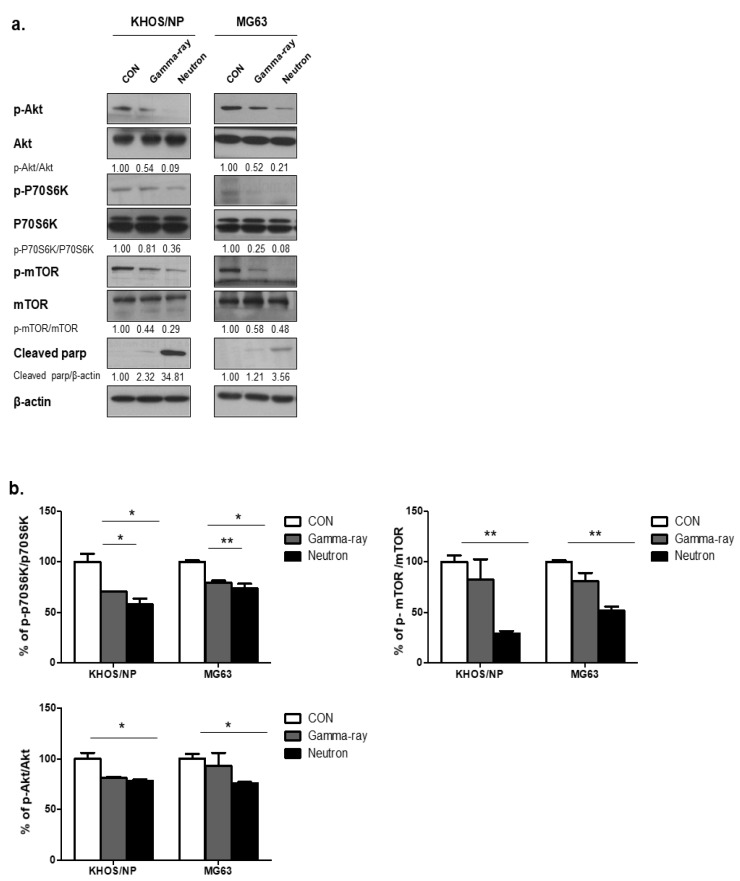
Figure 3.
Akt-mTOR signaling pathway activation by gamma-rays or neutrons. (a) Immunoblot analysis of p-AKT, p-70S6K, p-mTOR, and cleaved PARP in KHOS/NP and MG63 cells treated with radiation for 48 h. (b) ELISA was performed to quantify the levels of phospho-mTOR, mTOR, phospho-AKT, and AKT in KHOS/NP and MG63 cells after irradiation. Each concentration was tested in quadruplicate, and each experiment was repeated twice. The data shown represent the mean ± SD from two independent experiments combined; * p < 0.05, ** p < 0.01.

