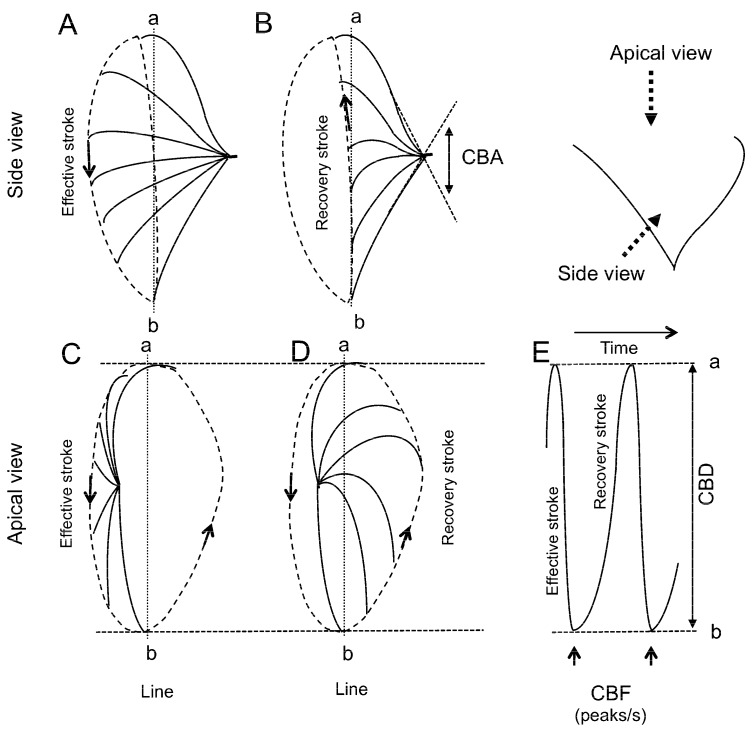
Figure 2.
Schematic diagram of ciliary beating. The cilium travels in different planes during the effective and recovery strokes. During the effective stroke, the cilium tip moves in an arc with maximum speed in the plane perpendicular to the cell surface, and then, in the recovery stroke, the cilium swings back close to the cell surface. (A,B) Side view. Panels A and B show the effective stroke and the recovery stroke, respectively. The angle between the start and the end of the effective stroke is the ciliary beat angle (CBA, an index of ciliary beat amplitude). (C,D) Apical view. Panels C and D show the effective stroke and the recovery stroke, respectively. (E) The time course of changes in the light intensity of line a–b. To assess the amplitude of ciliary beating in the apical view, the distance between the start and the end of the effective stroke was measured. The measured distance is the ciliary beat distance (CBD, another index of ciliary beat amplitude). CBF, ciliary beat frequency.

