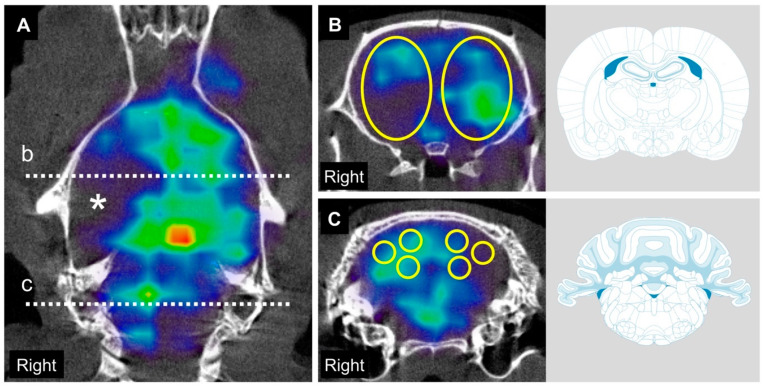
Figure 1.
Single photon emission computed tomography (SPECT)/computed tomography (CT) images and regions of interest (ROI) settings to evaluate cerebral and cerebellar blood flow after MCAO. SPECT acquisitions were color-coded with National Institute of Health spectrum color scale. (A), Vertical section of SPECT/CT image obtained 2 days after middle cerebral artery occlusion (MCAO) shows obvious hypointensity at the right middle cerebral artery territory (*). Dashed line “b” indicates the coronal slice 2 mm posterior from bregma and dashed line “c” indicates the coronal slice 11 mm posterior from bregma. (B) In the coronal slice 2 mm posterior from bregma, 6 × 9 × 6 mm 3D-elliptical ROIs were symmetrically placed. (C) In the coronal slice 11 mm posterior from bregma, 2 × 2 × 2 mm global ROIs were symmetrically placed at medial cerebellar cortex, lateral cerebellar cortex and cerebellar nuclei of each side respectively.

