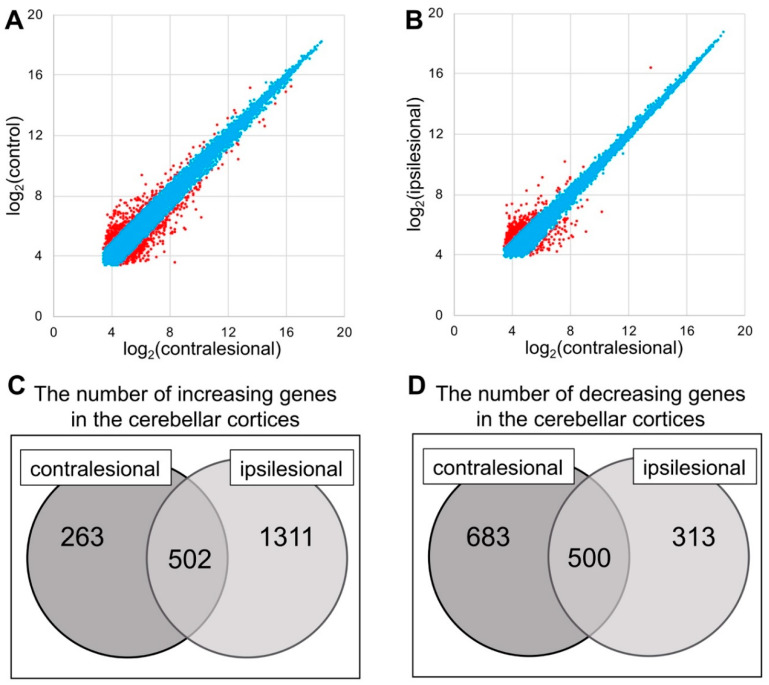
Figure 3.
(A,B) Correlation plot of the contralesional, ipsilesional and control group. The genes with expression change between two conditions <2.0× are labeled as blue and ≥2.0× as red. (C,D) The mRNA gene expression ratio was expressed as the ratio of the fluorescence intensity of the contra-or ipsilesional group to that of the control group. Increasing genes were defined as those for which Log2 (ratio) > 1 if the ratio was more than double, while decreasing genes were defined as those for which Log2 (ratio) < −1 if the ratio was less than one-half.

