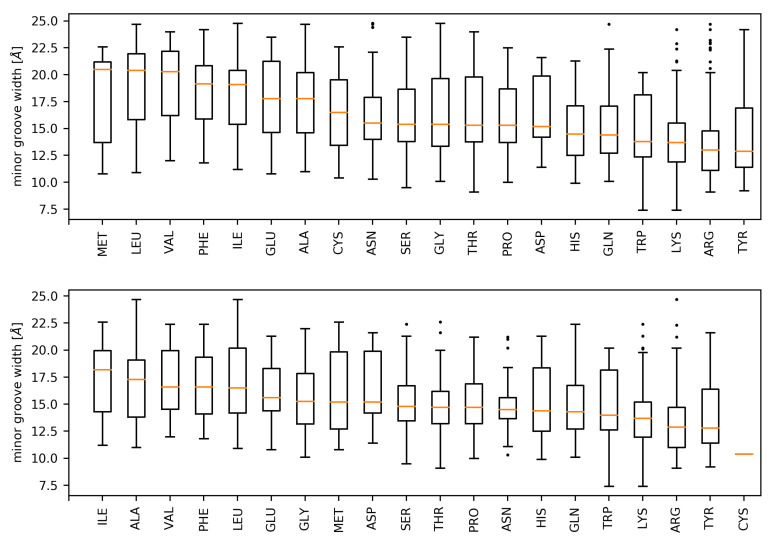
Figure 4.
Distributions of DNA minor groove widths associated with the dinucleotides bound by the respective amino acids (top: DS1, bottom: DS2). Amino acids are sorted in descending order according to the associated median minor groove width. Whiskers of the boxplots denote the first and last 25% of the distributions. Maximal length of a whisker was set to times the interquartile range. Any observations belonging to the whisker range that is further from the first/third quartile than this threshold is denoted as an outlier and marked as a dot in the plots.

