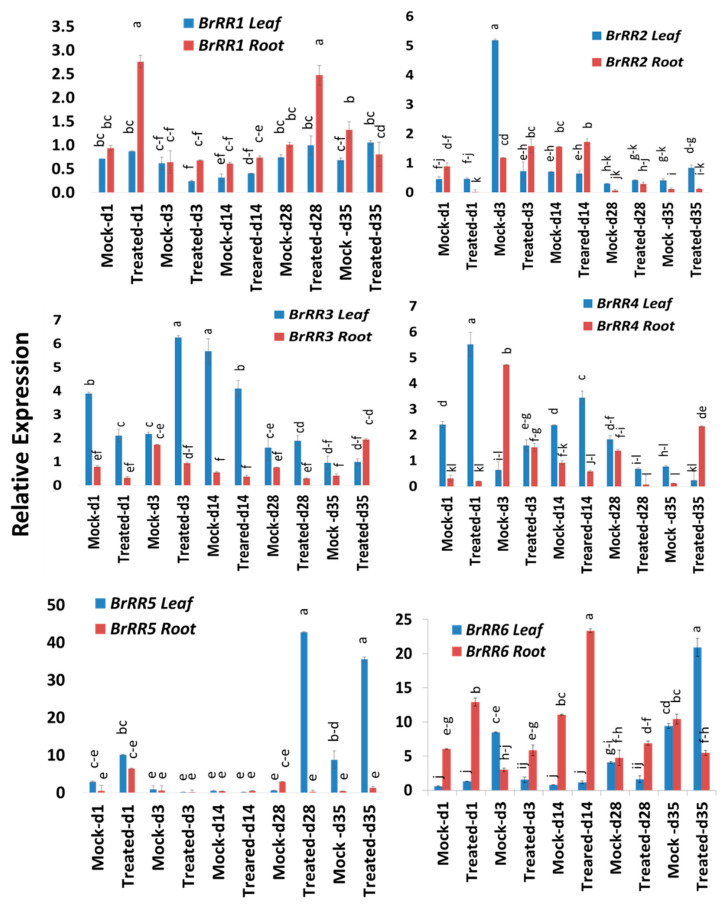
Figure 4.
Variation in relative expression levels of BrRR cytokinin-related genes in leaf and root samples under different treatment × time-point combinations. Vertical bars compare relative expression levels among leaf vs. root, mock vs. treated samples at five time-points. Each data point represents the average of three samples. Vertical bars represent standard deviation. Values with different letters are significantly different at 5% level of significance according to Tukey’s pairwise comparisons. Gene expression levels in leaves from non-treated plants on Day 0 were set to 1.

