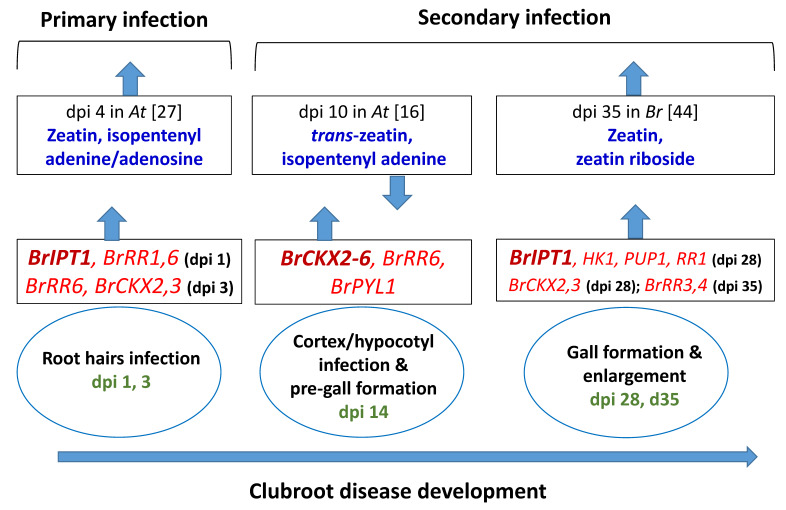
Figure 8.
Association between relative expressions of cytokinin biosynthesis, response regulating and degrading genes in this study (red color) and published cytokinin contents at the closer time-points in Arabidopsis thaliana and Brassica rapa (blue color). dpi, days post inoculation. Green color represents dpi at which samples were collected. Upwards- and downwards-pointing arrows represent upregulation/increase and downregulation/decrease of genes/cytokinin contents, respectively, in clubroot infected plants compared to non-infected plants.

