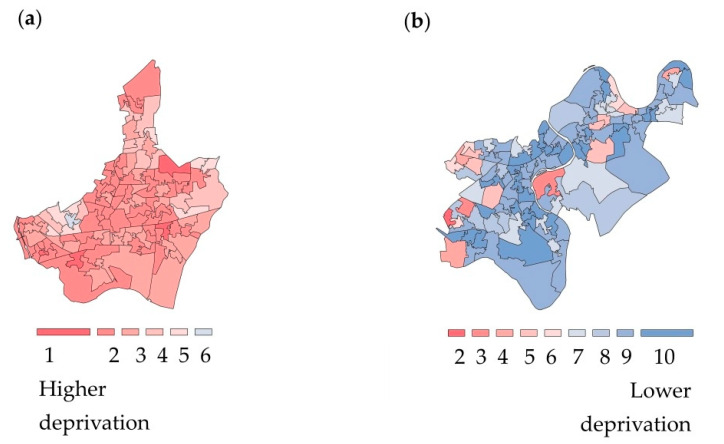
Figure 2.
Visualizations of social deprivation of the living environment according to the Index of Multiple Deprivation. Choropleth maps of the Lower-layer super output areas by decile of the Index of Multiple Deprivation (IMD): (a) Barking and Dagenham, London; (b) Richmond upon Thames, London. According to the scale, one (red) refers to the most deprived 10% of neighborhoods, and ten (blue) represents the least deprived 10% of neighborhoods, in England. Contains Ordinance OS data © Crown copyright and database right (2020) [37].

