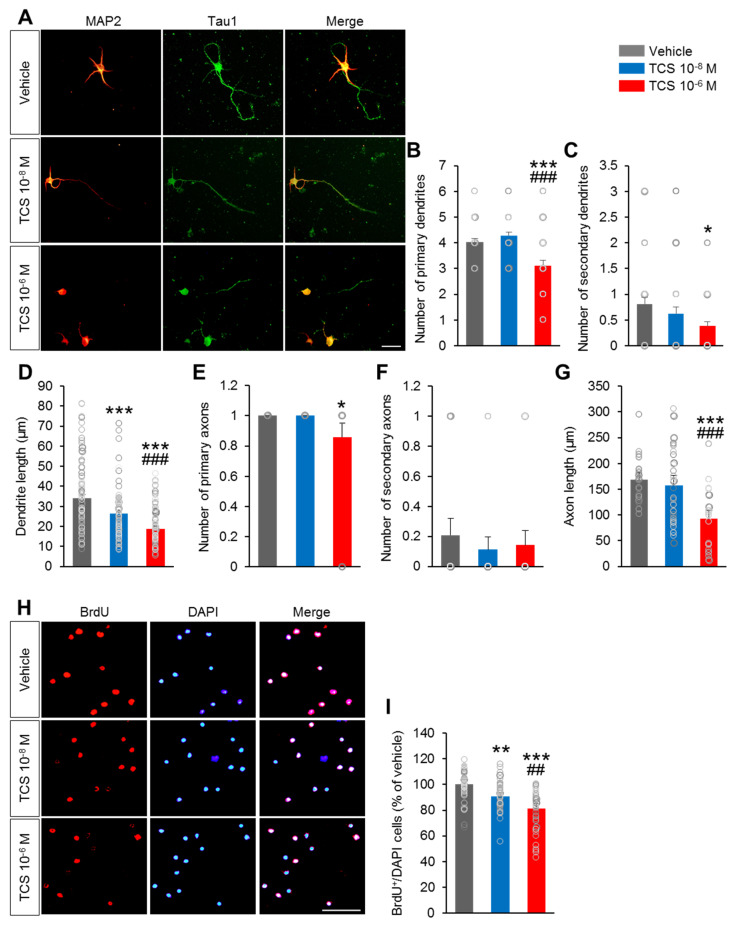
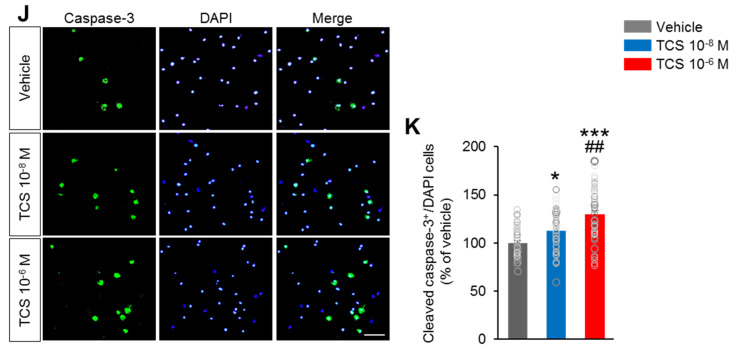
Figure 1.
TCS impair to axon and dendrite growth. (A) Representative images of cultured mouse cortical neuron fluorescently labeled for MAP2 and Tau1. Scale bar, 100 µm. (B–D) Quantification of primary and secondary dendrite. (B) Number of primary dendrites, (C) number of secondary dendrites, (D) Average dendrite length. TCS 10−8 M group showed a markedly decreased the length of primary dendrites but did not change the number of primary dendrites and secondary dendrites compared to vehicle group. TCS 10−6 M group exhibited the significantly lower in the number of primary dendrites. The length of primary dendrites was also decreased in the TCS 10−6 M group compared to the vehicle group. (E–G) Quantification of primary and secondary axon. (E) Number of primary axons, (F) number of secondary axons, (G) average axon length. TCS 10−8 M group showed no significant difference in the number of primary and secondary axons. The length of axon and the number of primary axons were also decreased in TCS 10−6 M compared to the vehicle group. n = 5 cell culture replicates using 5 mice for each condition (cell counts: 250 cells for each group). (H) Primary cortical neuronal cells were cultured from E15 mice and treated TCS at DIV 1. The cells were then incubated with 10 μM BrdU for 2-4 h after 12 h adding TCS, fixed and immunofluorescence with BrdU antibodies. Scale bar, 40 μm. (I) Quantification of A. TCS-treated groups exhibited lower in the percentage of cleaved BrdU+ cells compared to vehicle group. The percentage of cleaved BrdU+ cells in the TCS 10−6 M group was significantly lower compared to the TCS 10−8 M group. (J) Cell death was assessed in vehicle and TCS-treated groups by immunofluorescence using a cleaved caspase-3 antibody on DIV 2. Scale bars, 100 μm. (K) Quantification of C. The percentage of cleaved caspase-3+ cells was markedly higher in TCS 10−8 M and TCS 10−6 M groups. The percentage of cleaved caspase-3+ cells in the TCS 10−6 M group was higher compared to the TCS 10−8 M group (cell counts: 1,000 cells for each group). Data represent mean ± SEM. Statistical significance was determined by one-way ANOVA with Bonferroni correction. * p < 0.05 vehicle vs. TCS, ** p < 0.01 vehicle vs. TCS, *** p < 0.001 vehicle vs. TCS, ## p < 0.01 TCS 10−8 M vs. TCS 10−6 M, ### p < 0.001 TCS 10−8 M vs. TCS 10−6 M. Treatments: vehicle; 0.1% DMSO, TCS; 10−6 mol/l or 10−8 mol/L.


