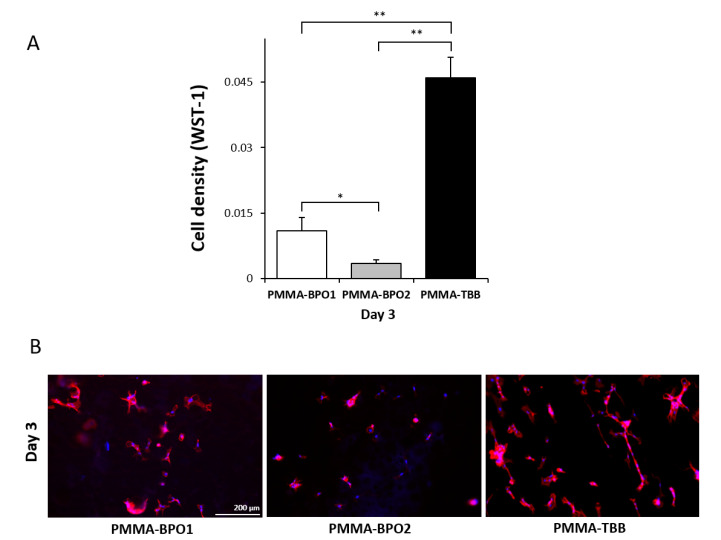
Figure 2.
Proliferation of osteoblasts on the three different bone cement surfaces during the mid-stage of the culture. (A) The number of cells attached to the surface of each material at day 3 of incubation, evaluated using a WST-1 assay. (B) Visualized osteoblasts 3 days after seeding on the material. Representative fluorescence microscopy images of cells stained with rhodamine phalloidin for actin filaments (red) and DAPI for nucleus (blue). Each value represents the mean ± standard deviation of triplicate experiments (n = 3). * p < 0.05, ** p < 0.01, one-way ANOVA followed by a Bonferroni test. Scale bar = 200 µm.

