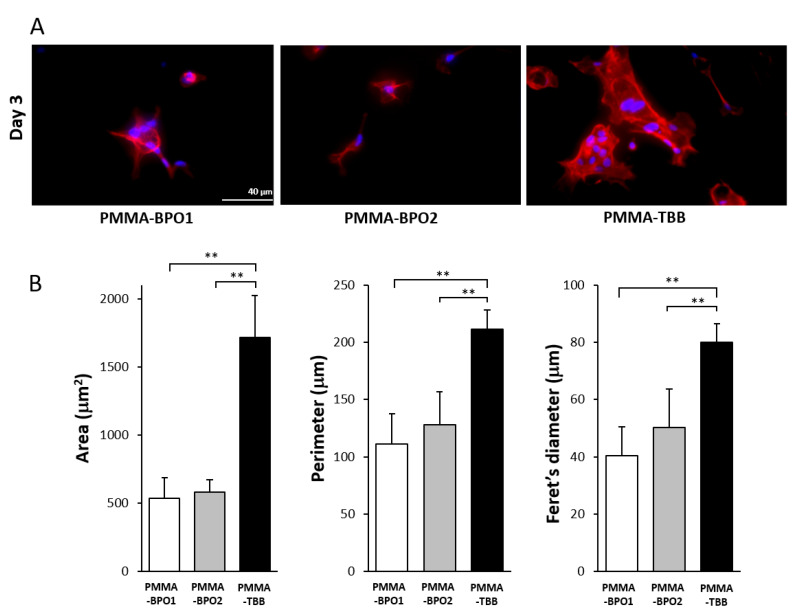
Figure 3.
Representative high-magnification fluorescence microscopy images of the spreading osteoblasts 3 days after seeding on three different bone cement surfaces. (A) Fluorescence microscopic images of osteoblast following immunochemical staining for cytoskeletal actin (red) and nucleus (blue). Scale bar = 40 µm. (B) Histograms for cytomorphometric parameters measured from the images. Each value represents the mean ± standard deviation of six measurements (n = 6). ** p < 0.01, one-way ANOVA followed by a Bonferroni test. Scale bar = 40 µm.

