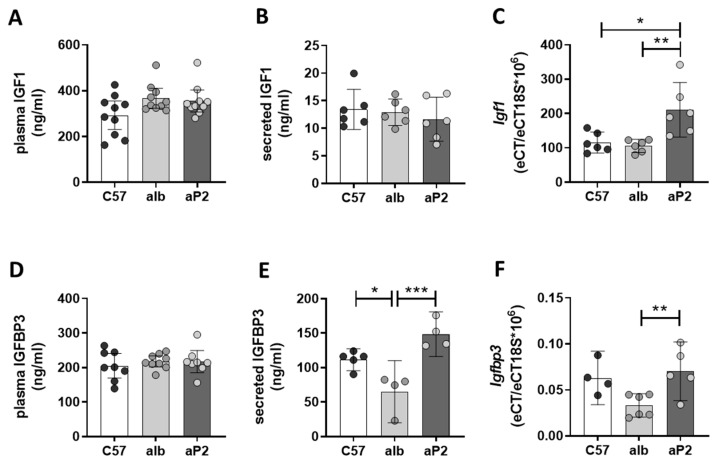
Figure 3.
IGF1 and IGFBP3 in mouse models. IGF1 and IGFBP3 levels in plasma (A,D), culture supernatants (B,E), and mRNA expression (C,F) in primary hepatocytes from C57Bl6 (C57), alb-SREBP-1c (alb), and aP2-SREBP-1c (aP2) mice. Data are expressed as mean (±95% CI; n = 4–10). Statistics: ANOVA with Sidak correction: *** p < 0.001, ** p < 0.01 and * p < 0.05.

