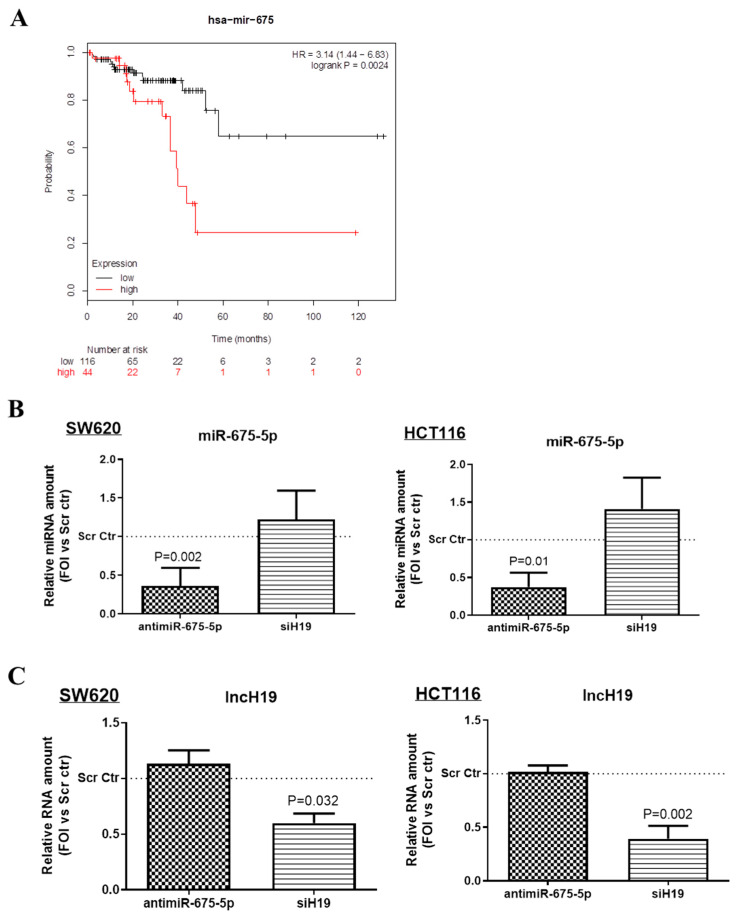
Figure 2.
MiR-675-5p regulation (A) Kaplan–Meier curve for overall survival in the cohort of 160 rectal cancer patients. The plot was drawn by using the online Kaplan–Meier plotter tool. Patients were divided into low and high expression groups based on an upper-tertile cut off value of 20. (B) Real-time PCR for miR-675-5p in SW620 (on the left) and HCT116 (on the right) transfected with AntimiR-675-5p, siH19 or relative scrambled negative control and subjected to 18 h of hypoxic stimulation. (C) Real-time PCR for lncH19 in SW620 (on the left) and HCT116 (on the right) transfected with AntimiR-675-5p, siH19 or relative scrambled negative control and subjected to 18 h of hypoxic stimulation. MiR-675-5p data were normalized for RNU6 (RNA, U6 Small Nuclear) while lncH19 levels were normalized for β-actin, ΔΔCt is expressed as fold of increase (FOI) with respect to scrambled negative control. Data are expressed as the mean ± SD of three independent experiments and p-values are indicated in the graph.

